

Success Story: RAYUS Radiology
Saving Reporting Time with Power BI

Client Overview
RAYUS Radiology provides medical imaging solutions throughout the United States.
Today, they operate one of the nation’s largest provider networks for diagnostic imaging, interventional radiology and mobile imaging services.
Services:
- Business Intelligence
- Paid Media
Client Segments:
- Health Care
Project Goal
Implement a reporting solution that allows us to save time on reporting to focus our efforts on taking action in the accounts.
Challenge
- Data accuracy: Data is at the heart of everything – if this is inaccurate, how would our clients trust our recommendations?
- Conversions were miscounting in the past and we had to figure out a way to fix the historical data.
- To help ensure future call conversions were accurate, we needed to integrate a new service API: CallRail.
- Identified a way to streamline conversions or events tracking for future projects.
- Time consuming: How do we effectively manage the accounts when spending so much time on reporting?
- The challenge before Power BI: we had to go into each account to pull data and find insights.
- Needed to identify a solution to easily report on new markets.
- Ease of use: How do we ensure the reports are meaningful throughout the organization?
- We helped identify who the report was for, and how to make it report actionable across multiple levels in the organization.
- We created different views. One view was high level for the executive team, while the other view contained regional details for the digital marketing team.
Our Approach
- Gathering data: Our data warehouse allows us to compare disparate data sources and avoid common pitfalls like data sampling.
- Processing: Data comes in all shapes and sizes. We pre-process our data to enrich datasets and prepare for easier analysis across platforms and datasets.
- Visualizing: Our aim is to completely eliminate the painstaking work of generating reports and jumpstart the process of discovering insights and driving impactful decisions.
- Power BI: We used Power BI to compile and visualize the data.
- Shareable Power Point Deliverables: We implemented a Power BI reporting solution for each account that easily pulls into a Power Point presentation to be shared across the client’s company
- Ease of use: switch the report by changing the account filter. Easily add in new markets and be able to scale. Durable, not a one time fix.
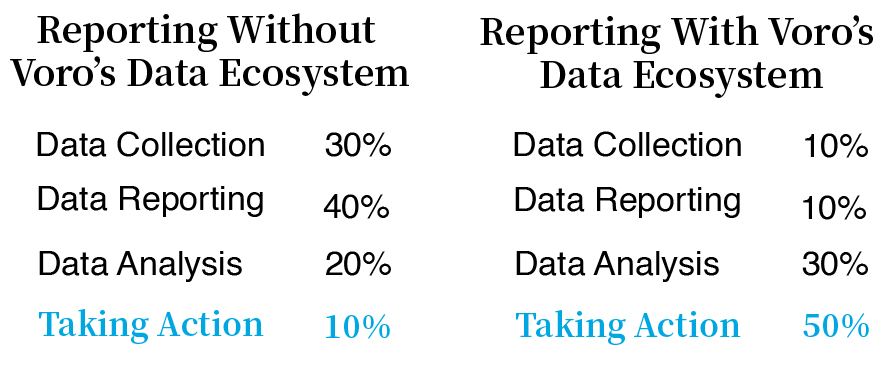
Results & Insights
Our time spent throughout the reporting period decreased by 65%, allowing us to spend more time identifying meaningful and actionable insights at scale.
What did we learn?
- With automation and real-time performance updates, our team spent less time gathering data and more time analyzing and uncovering opportunities to maximize results
- How to build a report for multiple levels that would be useful for everyone – How to integrate new API services in Power BI
- Able to shift their mindset to a more national approach
- Able to combine CallRail and paid media data to make more meaningful budget decisions
Tell us about your next project
Whether you have questions about how we can help your business or want to explore the possibility of working together, please contact us.